Pullbacks Galore

November, 2018

Nobody knows why the S&P 500 index declined more than 11% in October; the largest decline since, well, earlier this year.   

But experienced investors know that these declines are not unusual.  Since March 2009, the U.S. stock market has seen 23 pullbacks greater than 5%; eight greater than 10%.  You can see all of them on the accompanying chart; on average, these pullbacks have lasted 42 days and dropped prices by 9.3%.  And this is during a very long bull market! 

Interestingly, the S&P 500 today isn’t the same as it was back when the current bull market began; in fact, there are only 337 stocks remaining in the index that were included on March 9, 2009.  A small number—just 38 of them—accounted for much of the runup in the index, each gaining more than 1,000%. Most of the big gainers were technology stocks.   

Is there a lesson here?  Alas, we can’t extrapolate the short-term future from these statistics.  When stocks go on sale, it is often difficult to determine whether they will become even better bargains in the days ahead. 

Sincerely, 

Edward J. Kohlhepp, Jr., CFP®, MBA
President  

Edward J. Kohlhepp, CFP®, ChFC, CLU, CPC, MSPA

Founder & CEO

Sources: 

https://theirrelevantinvestor.com/2018/10/30/a-top-or-the-top/ 

https://pensionpartners.com/the-5-kinds-of-bounces/ 

This material was prepared by BobVeres.com., and does not necessarily represent the views of the presenting party, nor their affiliates. This information has been derived from sources believed to be accurate. Please note - investing involves risk, and past performance is no guarantee of future results. The publisher is not engaged in rendering legal, accounting or other professional services. If assistance is needed, the reader is advised to engage the services of a competent professional. This information should not be construed as investment, tax or legal advice and may not be relied on for the purpose of avoiding any Federal tax penalty. This is neither a solicitation nor recommendation to purchase or sell any investment or insurance product or service, and should not be relied upon as such. All indices are unmanaged and are not illustrative of any particular investment.


Continue reading
759 Hits

Stocks Go On Sale Again


October, 2018


If you’re the kind of person who like to worry, then October has given you plenty of stimulus.  After yesterday’s 3.1 percent drop in the popular S&P 500 index, the index has lost 8.8% in this month alone, wiping out all the gains that we’ve enjoyed this year, putting the index in negative territory.  The once-soaring Nasdaq Composite Index of technology companies tumbled 4.4% on the same day.


In times when the markets are dropping, even if they haven’t hit correction territory yet (that would be a 10% drop), the media needs to find a narrative, and you hear all sorts of theories.  Corporate earnings have nowhere to go but down.  The tariffs are slowing down economic activity.  Interest rates are rising.


All of that is true, but none of it has anything to do with why the markets are falling.  The only true headline, and one you will never read, is that stocks are falling because some people are losing faith in their investments and selling out to bargain hunters.  Sometimes this activity feeds on itself; when people see the market falling, they, too, begin to panic.


The stock markets periodically deliver losses for reasons which are not always obvious even after the fact.  Bear markets are a normal part of investing, and this is actually a good thing, because it allows real investors to periodically buy stocks at discounted prices.  Research has shown that there is a gap between the return that most investors get from their stock investments and the actual returns delivered by those stock investments.  This is, of course, because they sell this or that fund before it goes up, or sell out and then wait to get back in until the market has gone up past where they sold.  Getting the full return of the markets is relatively easy: just hang on during those periodic downturns.


But those downturns are terribly painful, right?  Take a look at this chart, created by First Trust Corporation, which shows the bull and bear markets since the Great Depression.  Notice that the downturns have been sharp but relatively brief, while the up-markets have been protracted and generous.  This has been the pattern up to now, and there’s no reason to think it won’t continue, unless you believe that the millions of people who go to work each day for their corporate employers are somehow destroying value instead of creating it.


You don’t need an explanation for why markets go down in order to benefit from them.  You just need the ability not to startle when the herd of investors suddenly makes an unexpected dash for the exits—to, as Warren Buffett once said, be greedy when others are scared, and scared when others are greedy.


Worry about the downturn if you want, but know that worry is the precursor to being scared.  And if you see somebody predicting where the markets are going to go from here, if they’re not wearing a wizard’s hat and gazing into a crystal ball, it’s probably best to turn off your attention.


Sincerely,


Edward J. Kohlhepp, Jr., CFP®, MBA
President 


Edward J. Kohlhepp, CFP®, ChFC, CLU, CPC, MSPA

Founder & CEO


Sources: 

https://allstarcharts.com/stock-prices-falling-perfectly-normal/ 

https://www.bloomberg.com/news/articles/2018-10-23/asia-stocks-look-mixed-as-late-u-s-rally-falters-markets-wrap?utm_campaign=socialflow-organic&utm\


This material was prepared by BobVeres.com., and does not necessarily represent the views of the presenting party, nor their affiliates. This information has been derived from sources believed to be accurate. Please note - investing involves risk, and past performance is no guarantee of future results. The publisher is not engaged in rendering legal, accounting or other professional services. If assistance is needed, the reader is advised to engage the services of a competent professional. This information should not be construed as investment, tax or legal advice and may not be relied on for the purpose of avoiding any Federal tax penalty. This is neither a solicitation nor recommendation to purchase or sell any investment or insurance product or service, and should not be relied upon as such. All indices are unmanaged and are not illustrative of any particular investment.


Continue reading
677 Hits

Beware the Bears


September 20, 2018


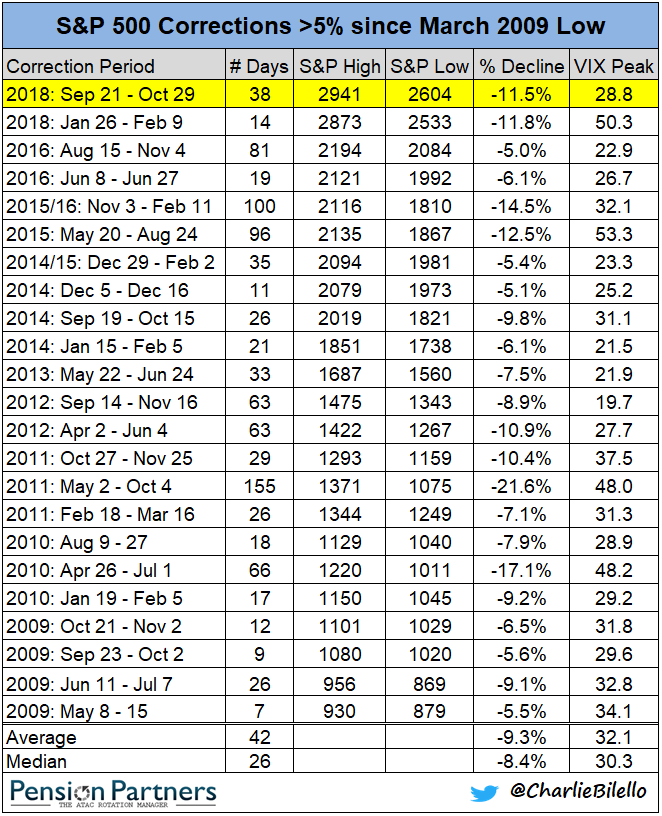
If you’ve been paying attention to the financial news lately, you’re probably seeing a lot of ominous predictions—and they’re usually backed up by some ominous headline.  The most simplistic are saying that the bull market has now lasted ten years, so therefore it’s about to come to an end—as if bull markets come with a time limit.  Others, equally simplistic, are saying that the market has reached a new high, and, well, don’t markets fall from their all-time highs?  This ignores the fact that more than 70% of the time, a new high is followed by another new high—and ultimately, so far in history, every new high has eventually been surpassed by the next one.


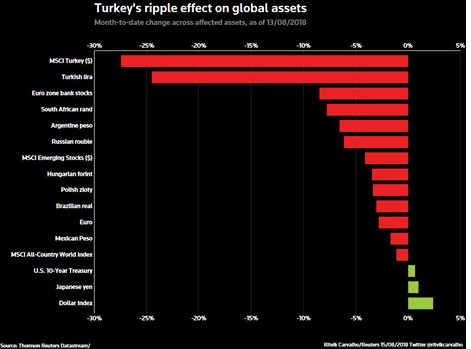
The more credible predictions are based on the fact that the U.S. debt is exploding, or that the U.S. is experiencing an expanding credit bubble in the government, corporate sector, and also—perhaps for the first time—the youngest workers with their crushing student loans.  The Fed is committed to raising interest rates, which will make all that debt more meaningful somewhere down the road.  And then we have the meltdown in Turkey, the potential consequences of reckless trade wars on the global economy, and the flat yield curve that is in danger of inverting.


The most important thing to know about all this is that there is no economic consensus that the U.S. or the world economy are about to plunge into recession in the next six to 12 months.  None of these simplistic arguments or ominous headlines, separately or together, add up to an imminent market meltdown or fire sale of the stocks that you’re holding in your portfolio.  That, of course, doesn’t mean that a meltdown couldn’t happen tomorrow, but it could just as easily happen one, two or three years down the road.  And it’s helpful to remember that various pundits have been predicting a major pullback constantly over the past nine years of bull market returns.  Anybody who was spooked by these pundits would have missed out on significant gains. 


This is more of the same noise, albeit with somewhat scarier headlines in the background.


Interestingly, the indicator that is taken most seriously in economic circles is the inverted yield curve.  We aren’t there yet, but the bond markets are certainly moving toward one of those rare times when two-year Treasuries are yielding more than 10-year bonds.  Every recession since 1977 has been preceded by a yield curve inversion.


But is this cause, effect or coincidence?  A recent article by Laurence Siegel, Director of Research at the CPA Institute Research Foundation, acknowledges that inverted yield curves have been a pretty good predictor in the past.  But he says that in the present marketplace, there is, as yet, no pressure coming from the things that a recession corrects: high inflation, high levels of debt, rich stock market valuations (though we may be moving in that direction), and tightness in the labor market. 


A yield curve inversion affects the supply and demand for capital, which can have impacts on the economy which could cause a recession.  It discourages banks from doing what they were made to do: borrowing short and lending long to viable businesses that are expanding.  In the past, there may have been a more direct cause and effect than there is today.  Today, banks can turn to hedge funds and a variety of other lenders who will allow them to borrow short at reasonable rates.


The bigger point is that recessions are inherently unpredictable.  If we had a reliable way to predict them, we would already be in them, because companies, knowing the time and date of the recession, would pull back in anticipation of it, and simply bring it on more quickly.  The same is true of major market pullbacks; if you, or I, or anyone else knew when it was going to happen, we would already be running for the exits, triggering the pullback prematurely.


Bottom line: we don’t know when or where the pain will come; we only know THAT it will come.  And we know with some certainty the direction of the next 100% movement in the markets.  That may be enough.


Sources:


https://www.ft.com/content/58d1ce9c-b5a2-11e8-bbc3-ccd7de085ffe


https://www.advisorperspectives.com/articles/2018/08/20/dont-be-fooled-by-the-yield-curve


This material was prepared by BobVeres.com., and does not necessarily represent the views of the presenting party, nor their affiliates. This information has been derived from sources believed to be accurate. Please note - investing involves risk, and past performance is no guarantee of future results. The publisher is not engaged in rendering legal, accounting or other professional services. If assistance is needed, the reader is advised to engage the services of a competent professional. This information should not be construed as investment, tax or legal advice and may not be relied on for the purpose of avoiding any Federal tax penalty. This is neither a solicitation nor recommendation to purchase or sell any investment or insurance product or service, and should not be relied upon as such. All indices are unmanaged and are not illustrative of any particular investment.


Continue reading
1116 Hits

Behind the Turkish Meltdown


August, 2018


What the heck is going on in Turkey?  Whatever it is, it’s having a visible effect on the markets.  After the Turkish stock market index fell more than 24% since the start of August, Eurozone bank stocks fell 24% and emerging markets stocks overall (a category which includes Turkish stocks) dropped 9.9% for the year.  A number of non-major currencies, including the South African Rand, Argentine peso, Russian ruble, Hungarian forint, Polish zloty, Brazilian real and Mexican peso were also down sharply, as was one major currency: the euro.  (See chart).  

The crisis was triggered when Turkish officials detained, and ultimately imprisoned, an American evangelical pastor named Andrew Brunson, accusing him of being a spy who was attempting to overthrow the Turkish government.  Before being detained, Brunson had been working as a pastor at the Izmir Resurrection Church, as a 23-year resident of the country.  His trial is set for October. 

American diplomats have been pushing for Brunson’s release, saying that he is basically on trial for his faith, not for any nefarious spying activities.  When the negotiations failed, the Trump Administration surprised Turkey and the rest of the world by imposing economic sanctions against what most would consider to be an allied government—a fellow NATO member whose Incirlik air base was a crucial staging ground for the air war against the Islamic state. 

The sanctions were clearly the trigger event for the collapse of Turkish stocks and the Turkish lira, but some analysts say the country was long overdue for some kind of negative event in the Turkish economy for some time.  In recent years, Turkey has been compared to Greece for having amassed one of the largest foreign debts in the world, as its banks and large companies have borrowed heavily to maintain activity in the economy.  Foreign investment has dramatically slowed, in part because the country’s authoritarian government seems often inclined to meddle in monetary decisions.  Those concerns were not exactly allayed when, in response to the crisis, Turkish president Recep Tayyip Erdogan squeezed central bank liquidity and doubled the interest rate cost in his country, in a single day, and then, by fiat, changed the rules so that speculators were no longer allowed to sell their for dollars or euros in what are known as currency swaps.  Banks were forced to stop lending lira or renew any existing contracts. 

In addition, Erdogan lashed out by doubling Turkish import tariffs on passenger cars to 120% of their value, plus a 140% tariff on alcoholic drinks, and significant tariffs on tobacco, cosmetics, rice and even coal.  In a subsequent speech, the Turkish president called for a citizen boycott of U.S. electronic products, including the iPhone. 

Is there any way out of this mess?  It seems clear that the Turkish government is backed into a corner, not wanting to look foolish or weak by releasing its American pastor.  They surely know that if or when they do, President Trump will do a very public, and humiliating, victory dance on the world stage.  We may see some kind of quiet prisoner swap involving persons detained by the Israelis, but that could be months or years down the road.   

In the meantime, the Turkish lira stopped its precipitous slide only when the oil-rich nation of Qatar stepped in to offer financial assistance in the form of a $15 billion loan.  This mess is going to blow over, but not without a few more scary headlines to come. 

Sincerely, 

Edward J. Kohlhepp, Jr., CFP®, MBA
President  

Edward J. Kohlhepp, CFP®, ChFC, CLU, CPC, MSPA

Founder & CEO


This material was prepared by BobVeres.com., and does not necessarily represent the views of the presenting party, nor their affiliates. This information has been derived from sources believed to be accurate. Please note - investing involves risk, and past performance is no guarantee of future results. The publisher is not engaged in rendering legal, accounting or other professional services. If assistance is needed, the reader is advised to engage the services of a competent professional. This information should not be construed as investment, tax or legal advice and may not be relied on for the purpose of avoiding any Federal tax penalty. This is neither a solicitation nor recommendation to purchase or sell any investment or insurance product or service, and should not be relied upon as such. All indices are unmanaged and are not illustrative of any particular investment.


Sources:

https://www.reuters.com/article/us-turkey-markets-contagion/turkey-tantrum-investors-fret-over-contagion-from-lira-plunge-idUSKBN1L00YJ 

https://www.nytimes.com/2018/08/01/world/europe/us-sanctions-turkey-pastor.html 

https://www.cnn.com/2018/07/29/politics/andrew-brunson-pastor-turkey-detained/index.html 

https://www.reuters.com/article/us-turkey-usa-tariffs/turkey-doubles-tariffs-on-some-u-s-imports-lira-rallies-idUSKBN1L00BI 

https://www.theguardian.com/business/live/2018/aug/15/turkish-lira-crisis-turkey-raises-tariffs-on-us-goods-business-erdogan-markets-live 

https://www.ft.com/content/15c9909a-a089-11e8-85da-eeb7a9ce36e4


Continue reading
1300 Hits

The Growth Spike


The Growth Spike


August, 2018


Recent reports about the U.S. economy were a case of good news and bad news.  The good news is that, in the second three months of the year, the U.S. economy grew at an estimated 4.1%—better than the 2.2% growth posted during 2018’s first quarter.  The 4.1% figure is subject to revision as economists refine the numbers, but a 4% growth rate, if sustained through a period of years, would greatly bolster the wealth of all Americans. 

The bad news is that the economy will almost certainly not sustain this growth rate.  And despite what you are hearing from political pundits, there is also nothing remarkable about a single quarter’s 4.1% GDP increase.  As you can see from the chart, what has been labeled “historic” is actually pretty ordinary over the long term.  The economy exceeded last quarter’s level four times during the Obama presidency, in 2009, 2011 and twice in 2014.  4.1% growth would have been considered alarmingly slow during the Reagan presidency. 

Why can’t we sustain even this ordinary level of GDP growth?  Economists have noted that this spike in economic activity was not entirely unexpected, and is the result of a number of one-off events.  You might remember that Congress passed a significant corporate tax cut last. year, which kicks in at an unusual time: toward the end of a very long economic expansion, with consistently falling unemployment and rising home values.  The U.S. economy just entered its tenth consecutive year of growth.  Typically Congress will pass a stimulus package to bail the country out of recession.  One economist described the second quarter as an economy on a “sugar high.”  If you have ever had small children, you know how those often end. 

In addition, the quarter was aided (predictably) by foreign companies stockpiling U.S. goods before the threatened tariffs disrupt the flow of products across borders—temporarily boosting U.S. exports. 

Long-term, the GDP of any country is determined by the growth in the number of workers and the rising productivity of those workers as they labor at their desks and on the factory floor.  Neither of those factors are growing at anywhere near a 4% rate currently, which suggests that next quarter will see a return to the average 2-2.5% rate that we’ve experienced since 2009.  That, in turn, may explain why the U.S. stock indices actually fell on the day of the “historic” GDP announcement.  Savvy investors know better than to project one quarter’s results forward indefinitely into the future. 

Enjoy the rest of summer!


Sources: 

https://www.yahoo.com/finance/news/ap-fact-check-trump-falsely-044729698.html 

https://www.cbsnews.com/news/us-gdp-growth-touted-as-historic-by-trump-is-totally-standard/ 

https://www.cnbc.com/2018/07/27/us-gdp-q2-2018.html


This material was prepared by BobVeres.com., and does not necessarily represent the views of the presenting party, nor their affiliates. This information has been derived from sources believed to be accurate. Please note - investing involves risk, and past performance is no guarantee of future results. The publisher is not engaged in rendering legal, accounting or other professional services. If assistance is needed, the reader is advised to engage the services of a competent professional. This information should not be construed as investment, tax or legal advice and may not be relied on for the purpose of avoiding any Federal tax penalty. This is neither a solicitation nor recommendation to purchase or sell any investment or insurance product or service, and should not be relied upon as such. All indices are unmanaged and are not illustrative of any particular investment.


Continue reading
1210 Hits

Archived Newsletters


Investment Updates

  • Stocks Closed At A Record High

    The Standard & Poor’s 500 stock index closed Friday at a new all–time high,  ending the first quarter of the year with a gain of 10%. That’s as much as large-company stocks averaged annually  since 1926.

    Read more >>

  • Read More

Newsletters Sign Up

Account Login

Contact Info

Kohlhepp Investment Advisors, Ltd.
3655 Route 202, Suite 100
Doylestown, PA 18902
Phone: 215-340-5777
Fax: 215-340-5788
Email: Info@KohlheppAdvisors.com

Securities offered through Cambridge Investment Research, Inc. a Registered Broker/Dealer, Member FINRA/SIPC. Investment Advisory Services offered through Kohlhepp Investment Advisors, Ltd., a Registered Investment Advisor. Kohlhepp Investment Advisors, Ltd. and Cambridge Investment Research Advisors, Inc. are not affiliated.

Due to various state regulations and registration requirements concerning the dissemination of information regarding investment products and services, we are currently required to limit access of the following pages to individuals residing in states where we are currently registered. We are licensed in the following states: AZ, CA, CO, DE, FL, GA, IN, KY, LA, MA, MD, NC, NJ, NY, OR, PA, RI, SC, TX, VA, VT, WA


Check the background of this firm on FINRA's BrokerCheck